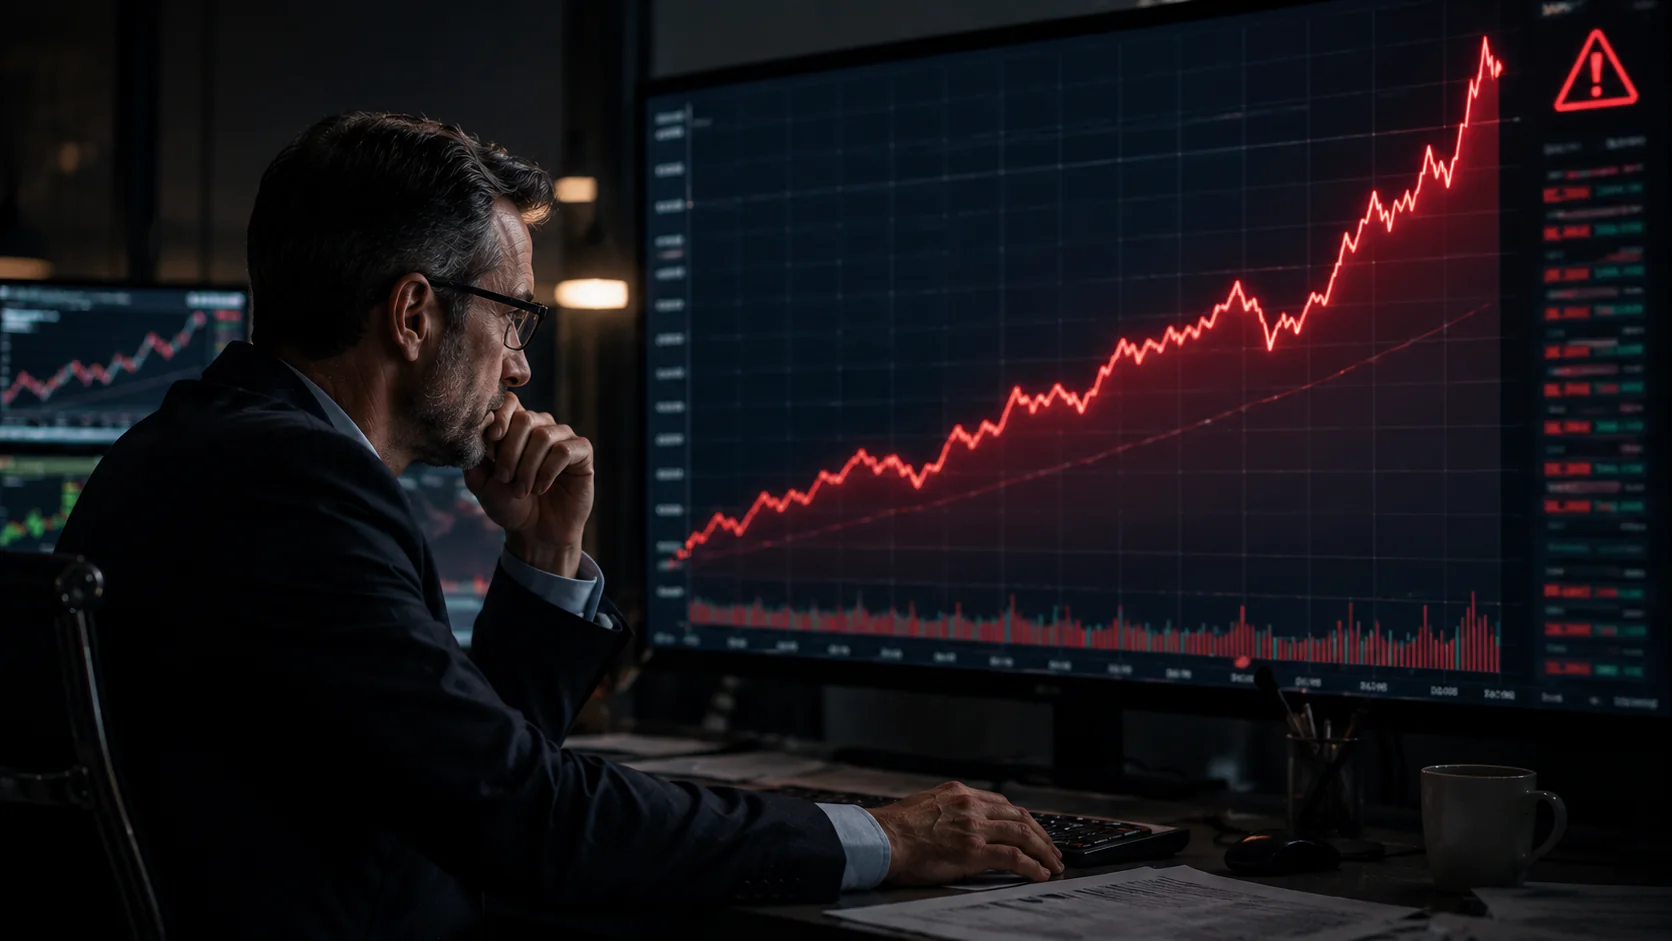
The U.S. stock market is flashing a warning that investors would be unwise to ignore: the S&P 500 is now trading at its most expensive valuation since the dot-com crash, at a moment when inflation is accelerating, economic growth is slowing, and the Federal Reserve may be forced to raise interest rates.
The S&P 500 recorded a cyclically adjusted price-to-earnings ratio of 39.6 in May, tied for the highest reading since September 2000. Since the index was created in 1957, the CAPE ratio has exceeded 39 on a monthly basis only about 3% of the time, and past instances have generally preceded substantial market losses.
What the CAPE Ratio Measures and Why It Matters
The CAPE ratio, introduced by Nobel Prize-winning economist Robert Shiller and his colleague John Campbell in 1988, is designed to filter out the noise of short-term earnings swings by using inflation-adjusted earnings averaged over the prior decade.
Unlike traditional price-to-earnings ratios that rely on a single year of earnings, the CAPE ratio provides a longer-term picture of whether the market is genuinely expensive relative to its fundamental earnings power.
At 39.6, the current reading is unambiguously elevated by any historical standard.
Historical data shows what typically followed the 27 prior instances in which the S&P 500’s monthly CAPE ratio topped 39. Over a one-year period, the index’s average return was negative 4%, with a worst-case decline of 28%.
Over two years, the average loss deepened to 20%, with a worst-case drop of 43%. Crucially, over every three-year period following a CAPE reading above 39, the S&P 500 has never delivered a positive return.
The Economic Backdrop Is Making Things Worse
The valuation concern is compounded by two simultaneous deteriorations in the underlying economic environment.
Inflation measured by the Federal Reserve’s preferred gauge, the Personal Consumption Expenditures price index, rose 3.8% on an annual basis in April, its highest reading in three years.
The surge is driven primarily by elevated energy prices tied to the Iran war’s disruption of global oil supply, and economists warn the peak may not yet have been reached.
At the same time, GDP growth in the first quarter came in at an annualized rate of 1.6%, well below the 10-year average of 2.6%.
Tariffs imposed by the Trump administration slowed both business investment and consumer spending during the period. Since Trump returned to office, quarterly annualized GDP growth has averaged just 1.9%.
The combination of high inflation and below-average growth is particularly dangerous for the market outlook. High inflation may force the Federal Reserve to raise interest rates, which would create an additional headwind to economic activity.
Futures traders are already pricing in at least one quarter-point rate increase within the next year, a significant shift from the rate-cut expectations that prevailed earlier.
Why Slowing Growth Matters for Stock Prices
The chain reaction from slower economic growth to lower stock prices is straightforward but easy to overlook when markets are near record highs.
Weaker economic growth eventually translates into slower corporate earnings growth. Corporate earnings are the primary driver of stock prices over time, which means a sustained period of below-average economic expansion will ultimately make it harder for the market to justify its current valuation level.
Profit margins hit a 15-year high in the first quarter, and Wall Street analysts expect AI-driven productivity gains to push margins higher in coming quarters.
That is the most credible argument for why the current CAPE ratio might be less alarming than history suggests: if future earnings grow faster than in the past, the market could grow into its valuation without a sharp correction.
However, that argument depends on assumptions about AI productivity gains materializing quickly and the Iran war resolving without further economic damage. Neither outcome is guaranteed.
What History Suggests Investors Should Do Now
The historical record following elevated CAPE readings does not call for panic, but it does argue strongly against complacency.
The fact that the S&P 500 has never delivered a positive return over any three-year period starting from a CAPE above 39 is a statistical warning that deserves serious consideration, even if it does not predict a specific outcome for any individual period.
The practical implication for investors is to focus on companies whose earnings are likely to be materially higher five to ten years from now, and only when those companies trade at reasonable prices relative to their fundamentals.
Reaching for expensive, speculative positions at the current valuation level historically carries significantly elevated risk of loss.
The S&P 500 has risen 20% since late March and closed higher for nine consecutive weeks. The conditions that supported that rally, tentative ceasefire optimism, strong AI earnings, and resilient consumer spending, remain present.
But the valuation signal the market is sending is the clearest warning investors have received in more than two decades.


0 Comments